
Please note that this article first was published in 2016 but has been updated with new numbers and screenshots from Google Analytics in September 2020.
There are many reports in Google Analytics that include “average” metrics: the average of pages/session, average bounce rate, average session duration, average time on page, and so on.
What is average session duration in Google Analytics and what does it entail? Average values can be very useful in analysing patterns and trends in our data, but we also need to be mindful of some of the risks and shortcomings inherent in these metrics.
This blog post will help you to understand and use the “average session duration” metric in Google Analytics.
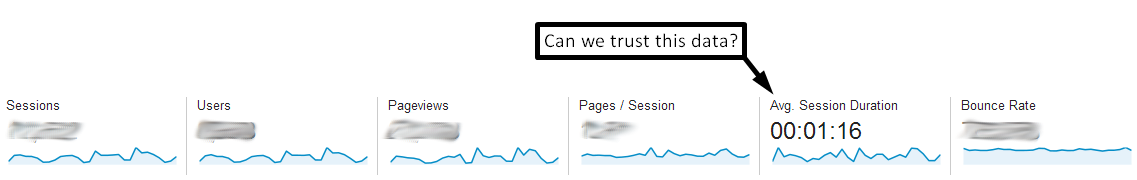
The simple answer is that we cannot trust this data. Why? Because it is an average of metrics which are themselves averages of other metrics, and so it goes on. For example:
Here we see that the site-wide average session duration was 1 minute (data period: 1st August-31st August 2020). Google Analytics always presents the average time on a page using this formula 00:00:00 to clearly differentiate between minutes and seconds.
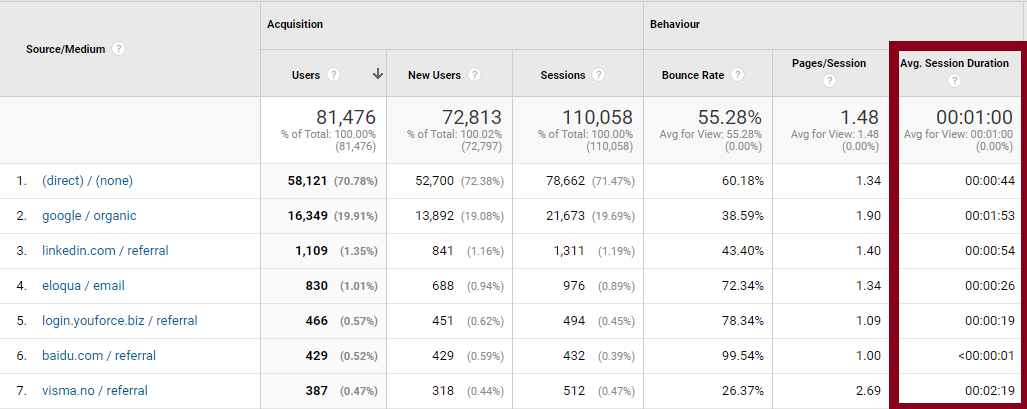
The average session duration for traffic coming from direct traffic is 44 seconds. The average session duration for traffic coming from Google organic search is 1 minute and 53 seconds. The average visit duration for traffic referred from LinkedIn is 54 seconds, and so on.
Already we begin to see that the site-wide average session duration is not as straightforward as it might appear at first glance. In addition, as with all average metrics, any outlying (extreme) values can dramatically skew the results.
So how should we handle these metrics, and can we gain any value from them?
Segment to get the most accurate numbers
Rather than relying on the site-wide average session duration, we analyse and report the “average session duration” for each individual traffic source. This gives us far better insight into the true “average session duration”, but it is still not the most efficient way to deal with averages.
In order to better understand the “average session duration” for the traffic, for example, coming in from “Google organic search”, we need to further segment this traffic source:
Step 1: Choose a primary dimension
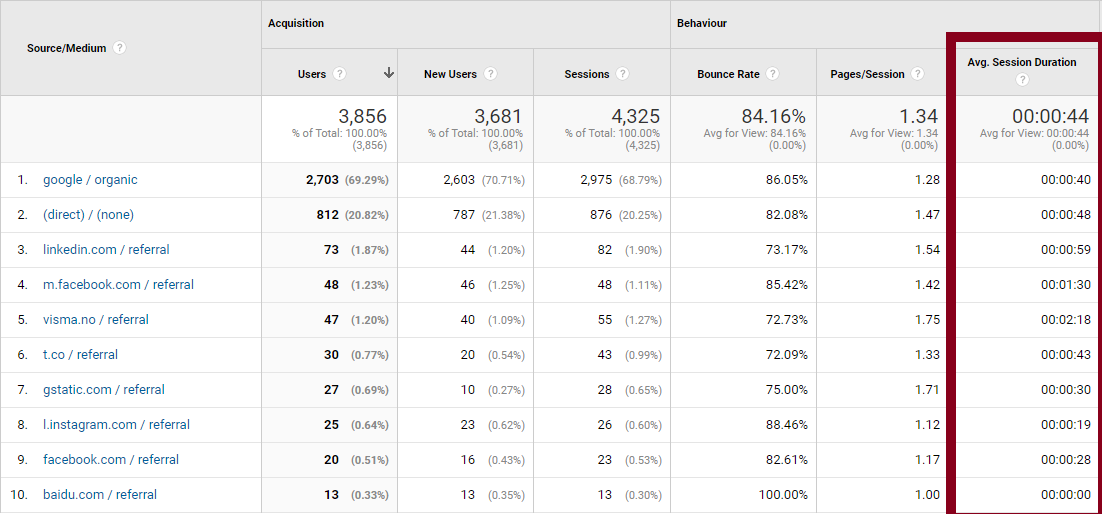
This is the “Channels” report which you can find in Google Analytics under the “Acquisition” drop-down in the left side navigation menu. In this example, I have already clicked “Organic Search” and also chosen “Source” as the Primary Dimension (the default is “Keyword”).
The report displays all the traffic sources (search engines) that are sending organic search traffic to our websites. The majority of our organic search traffic is coming in via Google, so it would be useful to further explore the “average session duration” for this traffic source.
Step 2: Choose a secondary dimension

Staying with the “Channels” report, select “city” as a secondary dimension:
We can now see the average session duration for Google organic search traffic, for each of the cities where these visitors reside. Let’s suppose we are planning a city-specific campaign, for example, for recruitment purposes, and we want to understand the on-site behaviour of visitors from Stockholm before targeting this location with PPC and other marketing activities.
The “average session duration” for these visitors will provide valuable insight into how we should plan and execute our campaigns.
Step 3: Create a custom advanced segment
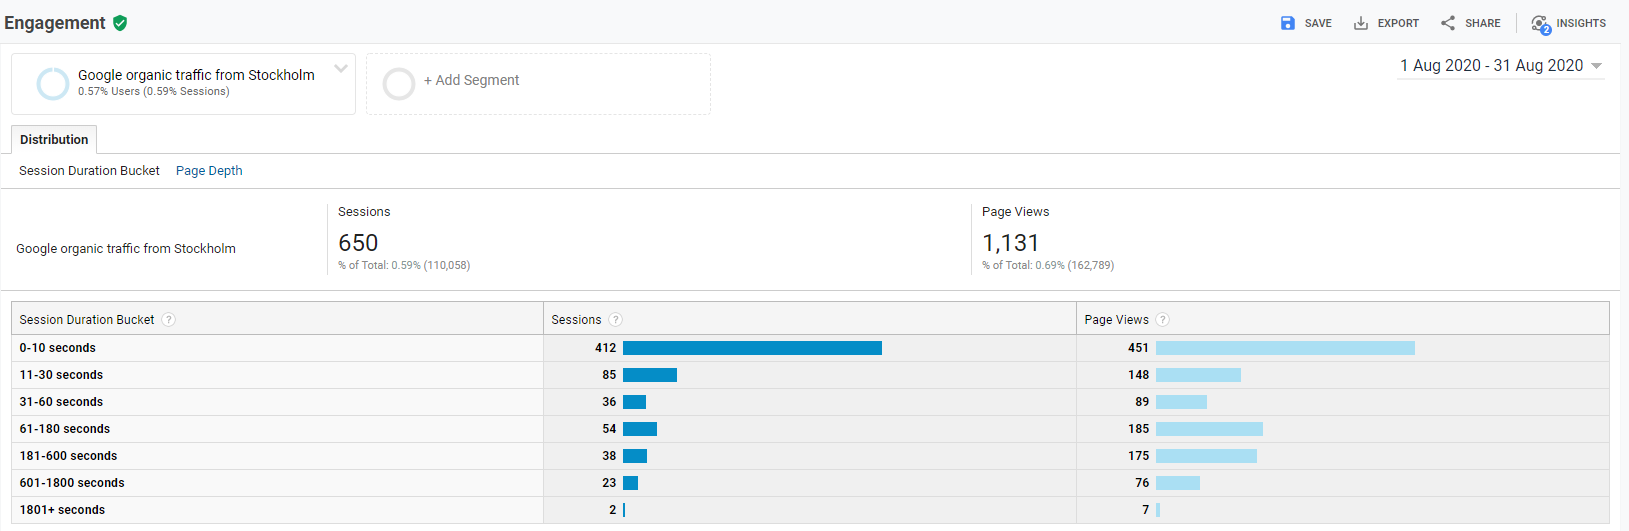
The next step then is to create a custom advanced segment which reports only the Google organic search traffic from Stockholm, and apply this to the “Session Duration” report (found under Audience > Behavior > Engagement):
In this example, we can see that 63% of the sessions last for 0-10 seconds, and 13% of the sessions last between 11-30 seconds. If we assume that it would take at least 3 minutes for a visitor to convert on our website, then only about 9,6% of the Google organic traffic from Stockholm has the potential to convert.
This type of distribution analysis gives us a far more accurate insight into traffic coming from Stockholm than the average session duration of 1 minute and 17 seconds that we saw in the previous report.
You might also be interested in: Data analytics as a Management Trainee
Data sampling
There is another issue worth mentioning which can also skew the “average session duration”, and that is data sampling. Google Analytics uses data sampling to analyse large data sets in an efficient and timely manner. If your Google Analytics reports are affected by data sampling then metrics such as “average session duration” can have inaccuracies of between 20 and 80%.
It is important in these cases to maximise the sample size (usually by choosing a shorter date-range) before using any average based metrics for analysis.
In conclusion, the decisions we make and budget allocated are (or should be) influenced by the analysis, interpretation, and reporting of user behaviour on our websites. For this reason, amongst others, we need to be careful and thorough when utilising average based metrics such as the “average visit duration”.
Want to learn more about how you can use data to find valuable insights for your business? Read more about data-driven business on our blog.