
In this article, Martin shares how they proceeded with the task to increase nursing care quality with time window expansions.
Interested in starting your career with us in Visma? Take a look at our career page.
Automating nursing care
Every day, employees in nursing care travel across counties to care for patients. Today, patients are assigned to different nurses manually. This quickly escalates into a huge jigsaw puzzle.
By automating the assigning process, more routes can be considered in less time. Better routes save valuable minutes when travelling and ensure that the patients are visited by familiar faces, increasing patient care quality.
Each patient must be visited during a specified time window. In the automated process, these time windows are set by the nursing care. The time windows greatly affect the quality of the generated routes.
This summer, Jonas and I worked on how to find the best suggestions for expansions in the time windows. That is, how can we increase the quality of the routes the most, for the least time window expansion.
Viewing the problem twofold, we focused on first selecting for which patient we were to expand the time window for, and then deciding upon how much to expand the time window.
Also read: AV1: A robot specifically developed for the classroom and school life.
Selecting the best patient tasks to expand
When selecting what task to expand, we came up with several different methods, with radically different approaches. One method would simply choose the node that was furthest away from the nursing care office, working under the hypothesis that assigning issues of patient tasks that are far away, have a larger impact on the route quality than patient tasks closer to the office.
Another one of our approaches was to identify what tasks had the most time conflicts with each other, that is, were guaranteed to overlap in time. We identified two sets of tasks, where all the tasks in each set were guaranteed to overlap with each other, and selected a specific task existing in both sets.
For the more mathematically and technically inclined, we represented the problem using what we called a conflict graph, with patient tasks as vertices and edges between tasks that were guaranteed to overlap in time. Below is an example of such a conflict graph:
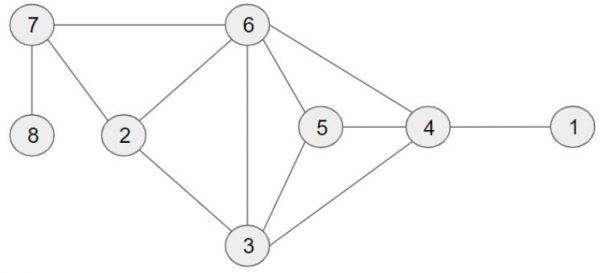
We identified the largest max clique that also had an adjacent clique. In the example graph, this is the set of nodes {3, 4, 5, 6}. The cliques adjacent to this max clique are {2, 6, 7}, {2, 3, 6} and {1, 4}.
Taking the intersection between the largest max clique and the adjacent cliques, we choose a task among the resulting set with the highest cardinality, in this case being:
{3,4,5,6}{2,3,6}={3,6}
Thus, we would select either task 3 or 6 for time window expansion.
When a task was selected for time window expansion, we had to decide how much to expand. There was a trade-off between how much you expand a task, and how much better the routes become.
Our approach to the problem was to for all, identify the least expansion needed to solve a guaranteed conflict between the task and a conflicting one. Then we could calculate how many conflicts we can solve per time unit, resulting in choosing the time window expansion that solves the most conflicts per unit time expanded.
For instance, given a selected task, if you could resolve one conflict by expanding the time window 2 time units or two conflicts by expanding 3 time units, the better option is to expand 3 time units, removing more edges, i.e. resolving more conflicts, per unit time expansion.
Read more: How can AI simplify kindergarten admission?
In the end, the model that proved to be the most efficient, in terms of providing the highest increase in quality of the routes for the least time expansion, was approximating the number of graph colourings our conflict graph had, using each employee of the nursing care as a colour.
In a very simple case, with three tasks and two employees, where two tasks conflict, the conflict graph would look like this:
We would then calculate how many different ways this graph could be coloured with two colours, for example red and blue, such that no two adjacent edges would have the same colour. A colouring such as this, having all red tasks is illegal because the two tasks sharing an edge have the same colour:
In fact, the number of different graph colourings this graph would have is 4:
In practice, we look at the number of different assignments of nurses to patient tasks, such that no two nurses are assigned to two conflicting tasks.
We then selected the task and the expansion that gave the highest increase in the number of assignments, for example the number of graph colourings, per unit time expansion.
This article is written by Martin Olstad Willoch.
Are you interested in developing the next optimisation solutions that streamline and improve processes within home health care, hospitals, schools and kindergartens in Europe?