
As designers we often wonder if one solution fits all different users alike, so we employ quantifiable customer satisfaction scores only to end up confused when responses that are equally divided between “old solution was better” versus “I like new the solution more”.
What makes one solution better than the other for one group of people is a deeply qualitative question. Since Visma InSchool is an administrative system for all upper secondary schools in Norway, mapping such diversity of needs is essential for us to fully utilise Visma UX value loop.
You can read more about how we implemented the Visma value loop in this blog post.
The diversity of user needs
As a UX researcher I work a lot with qualitative methods like interviews. I talk to many different people trying to understand their point of view. You will fail to walk in the user’s shoes if you only ask how they work inside of your system, you need to understand how they work WITH your system. What they do outside of it, is as important as what they do inside.
Why does Betty download the data, writes things in her excel sheet and then uploads it back, why Frank has notes alongside the system, why Joseph comes everyday 30 min earlier to work to be able to complete his daily task in time. The workarounds are the key to the things that don’t fit or match with their work process.
At the end of the day it’s computer supported work, not “I work like the computer tells me to”. And sometimes you have to accept that they don’t actually want your version of “good experience” at all, they want to see all data in one gigantic table, to be efficient, to spend less time in the application overall.
To understand different wants and needs we create personas that use our product in different ways.
Personas as a communication tool
Personas are fictional characters that we create based on research findings from multiple individuals. To make sure that these fictional archetypes are representative I note general emotional tone of the interview or rank their needs from high to low, sometimes I also include description of their work process flow and examples of personal tools used as workarounds.
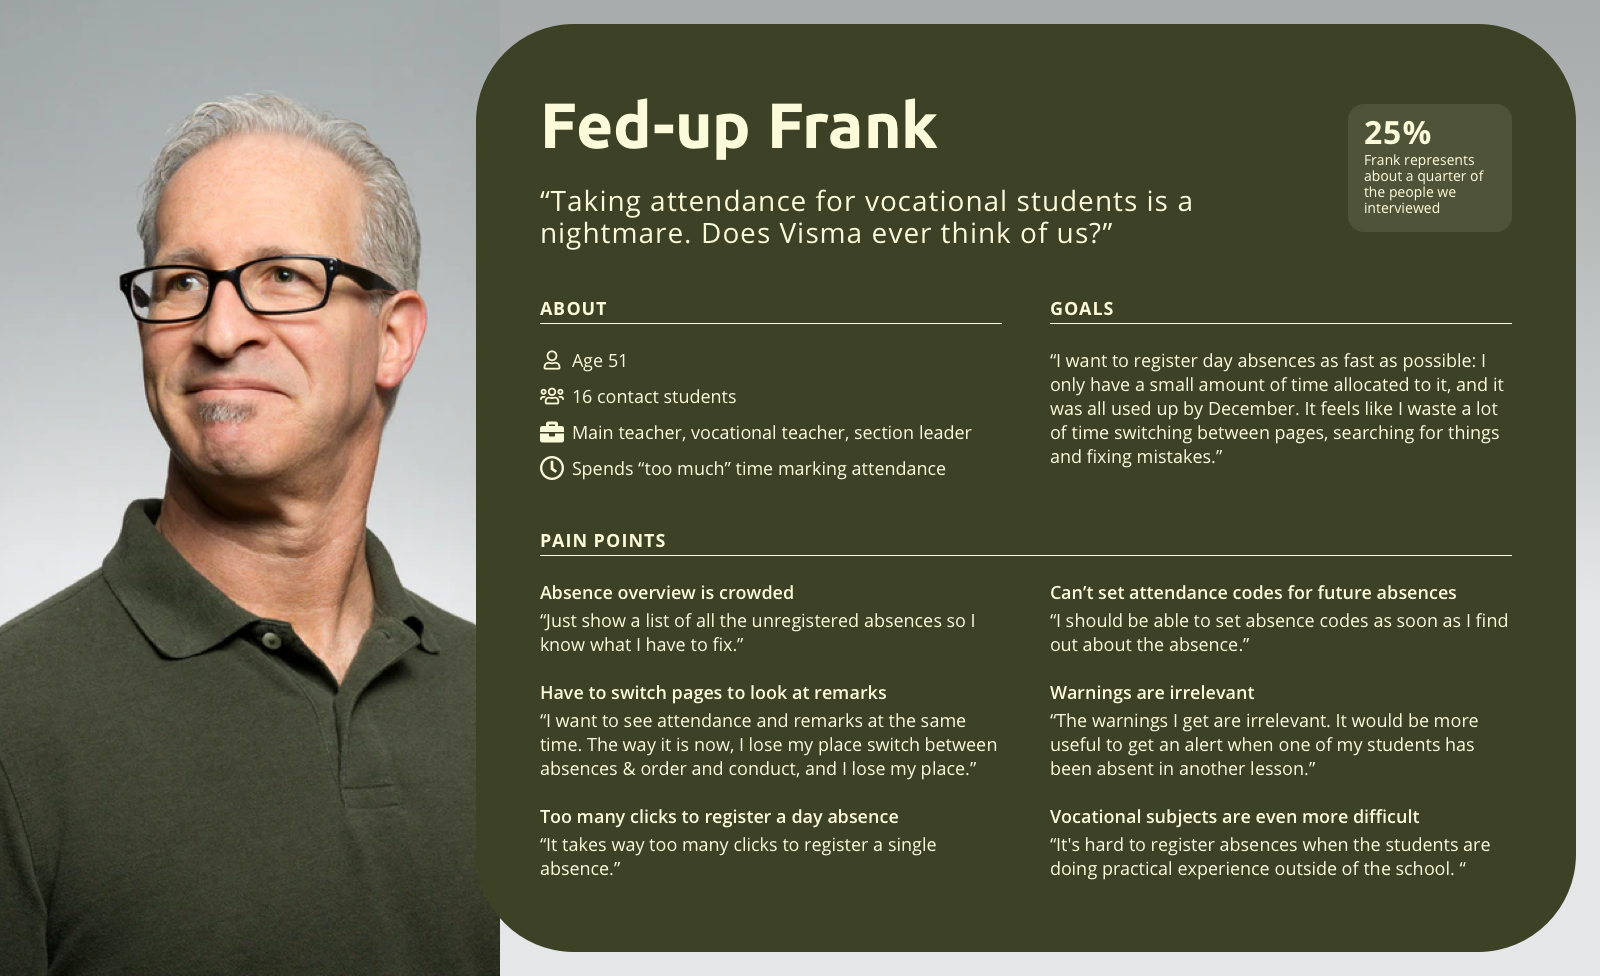
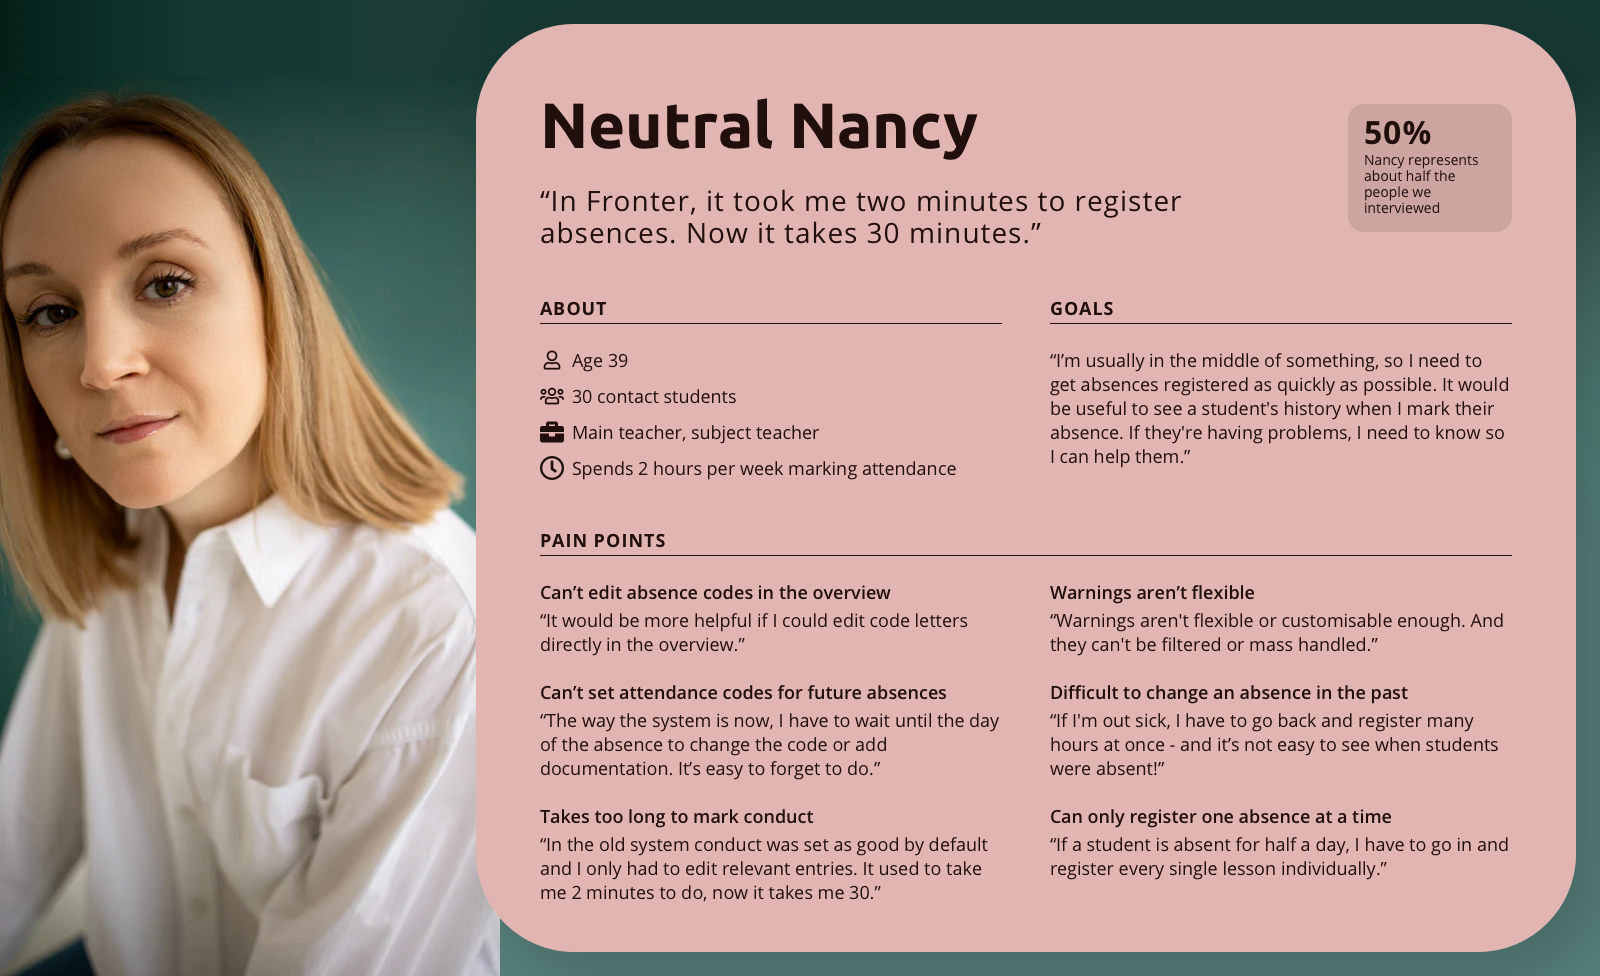
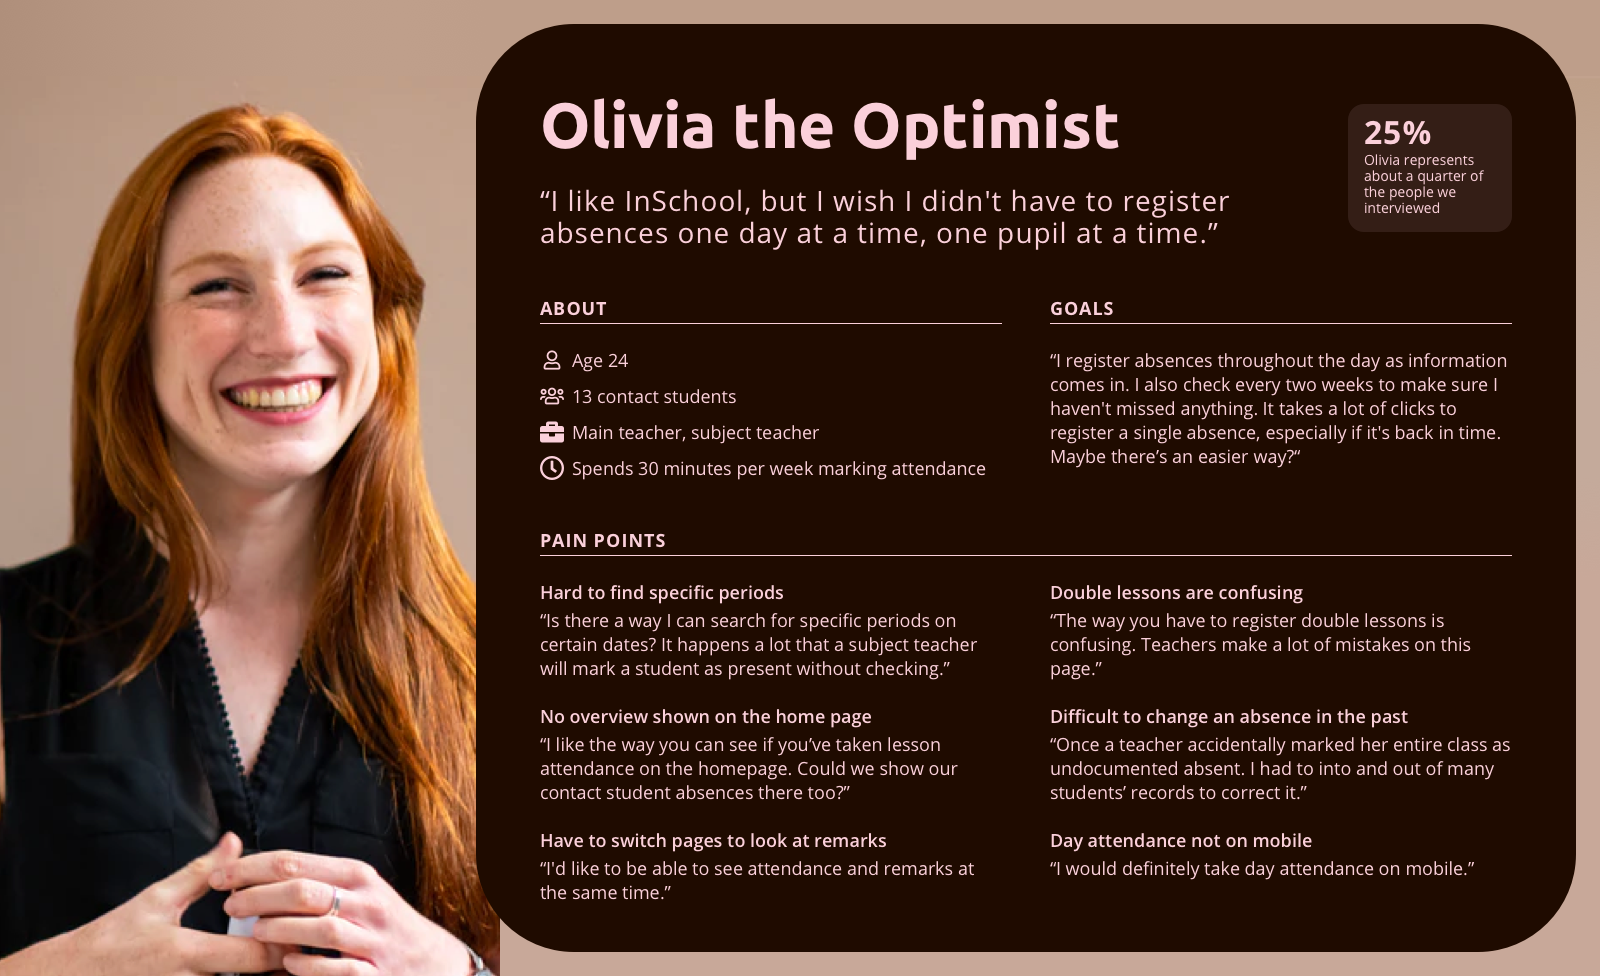
Meet the Optimist Olivia, Fed-Up Frank and Neutral Nancy. They represent our understanding of representative user characteristics from our latest research about contact teacher pain points. Visma InSchool is driven by development of contractual requests, however by communicating Persona descriptions we shift focus on actual user needs.
They allow us to bridge the fragmentation of development teams and arrive at shared understanding regarding users. Visma InSchool is a big multicultural project that has teams in Dublin, Riga, Vilnius and Oslo. So it’s inevitable that some things are lost in translation, so a tool that can explain at first glance the technicalities of a job from another country and culture is a lifesaver.
User research and descriptions of user groups can also highlight the mismatch between contractual requests written many years prior and current needs.
Dangers of preconceived opinions
It is inevitable that user-needs change with time or even as a result of implementing the system. It is also important to remember that different users have different needs because of their circumstances.
We have conducted research regarding how schools work with student options throughout the year. The result revealed that a percentage of users did not follow the process implemented in our solution based on contractual requirements. As a matter of fact they did everything other way around compared to the current workflow in the system.
The assumption was that firstly schools collect student subject choices, then do distribution of subjects and budgeting. However schools with limited resources do it the opposite way, first decide on budget and subject offers, then allocate the students, which means that they have to do a lot of workarounds to use our system for its intended purposes. This major specification was missed, because it was assumed that schools have standardized workflow for student options. We are going to work on student options in Q4 to help our users and make things more clear for them (check with our roadmap).
Mapping a diversity of needs is essential to design good solutions, however it is not always possible to collect such feedback efficiently through time consuming qualitative methods. Therefore we also employ quantitative solutions to ensure that user needs are well documented.
Quantifying User-Satisfaction
We use the customer satisfaction score (CSAT) tool to track how satisfied our users are with different functionalities in our system. It consists of a single question where users are asked to rate functionality on a scale from 1 to 5, followed by an opportunity to explain their score.
I then produce and distribute the quarterly reports to make sure everyone in the project is aware of the current situation. By comparing the results over time we are also able to define which areas are in most need of improvements or where we should focus our UX research efforts if needed.
For example, attendance was the most commented functionality with the lowest satisfaction score this year. Therefore we have conducted UX research and have started working on major improvements for both attendance and absence functionalities. We are planning on starting the development in Q4 and hope to deliver a new version in production the next school year. Currently we have two usability tests available for our reference group participants.
If you are an InSchool user and want to participate in testing or have feedback, you can sign up to our reference group mail list here.

Conclusion
UX research and hearing the users’ voices are essential for us to systematically follow everchanging user needs of approx. 200 000 active users. It allows us to collect data to understand how users perform their tasks, the goals that are important to them as well as how to improve our functionality to suit user needs better.
Our goal is to develop a solution that fully supports administration needs for upper secondary education. So that both teachers and students alike can do their daily tasks effortlessly and efficiently. And we do it one research at a time.